Drop in a dataset.
Get a living atlas.
Artemis BioLabs is the embedded computational team for wet labs — every assay, one engagement. This page shows one use case end-to-end: spatial transcriptomics, from raw folder to a living atlas with an AI copilot.
Visium · Xenium · CODEX → BANKSY → annotated Vitessce portal
Our team has trained and worked with researchers at








01 · PIPELINE
One command, five stages, zero notebooks.
Raw reads in, atlas out — the glyph stream is animation; the section it becomes is the real GBM1 data.
1Load + preprocess
Any .h5ad or 10x Xenium folder. Counts detected, normalized, log1p — spatial coordinates verified.
load_h5ad(input)2BANKSY clustering
Each spot is embedded with its neighborhood — clusters follow tissue architecture, not just expression.
λ=0.2 · k=15 · Leiden3Cell-state annotation
Controlled-vocabulary marker agent — Claude in the cloud, or a local model through Ollama.
AC·MES·NPC·OPC-like vocab4Vitessce portal
Chunk-optimized zarr + an interactive portal: spatial view, UMAP, heatmap, marker search.
portal.html + data.zarr5Live analysis + copilot
On-demand differential expression, composition, Moran's I — and a grounded chat on your data.
DE · Moran's I · chat02 · BANKSY
Clustering that sees the tissue.
Standard clustering sees each spot alone — expression without place. The tissue dissolves into noise.
BANKSY embeds every spot with its neighborhood — mean expression and an azimuthal gradient over the k-nearest ring.
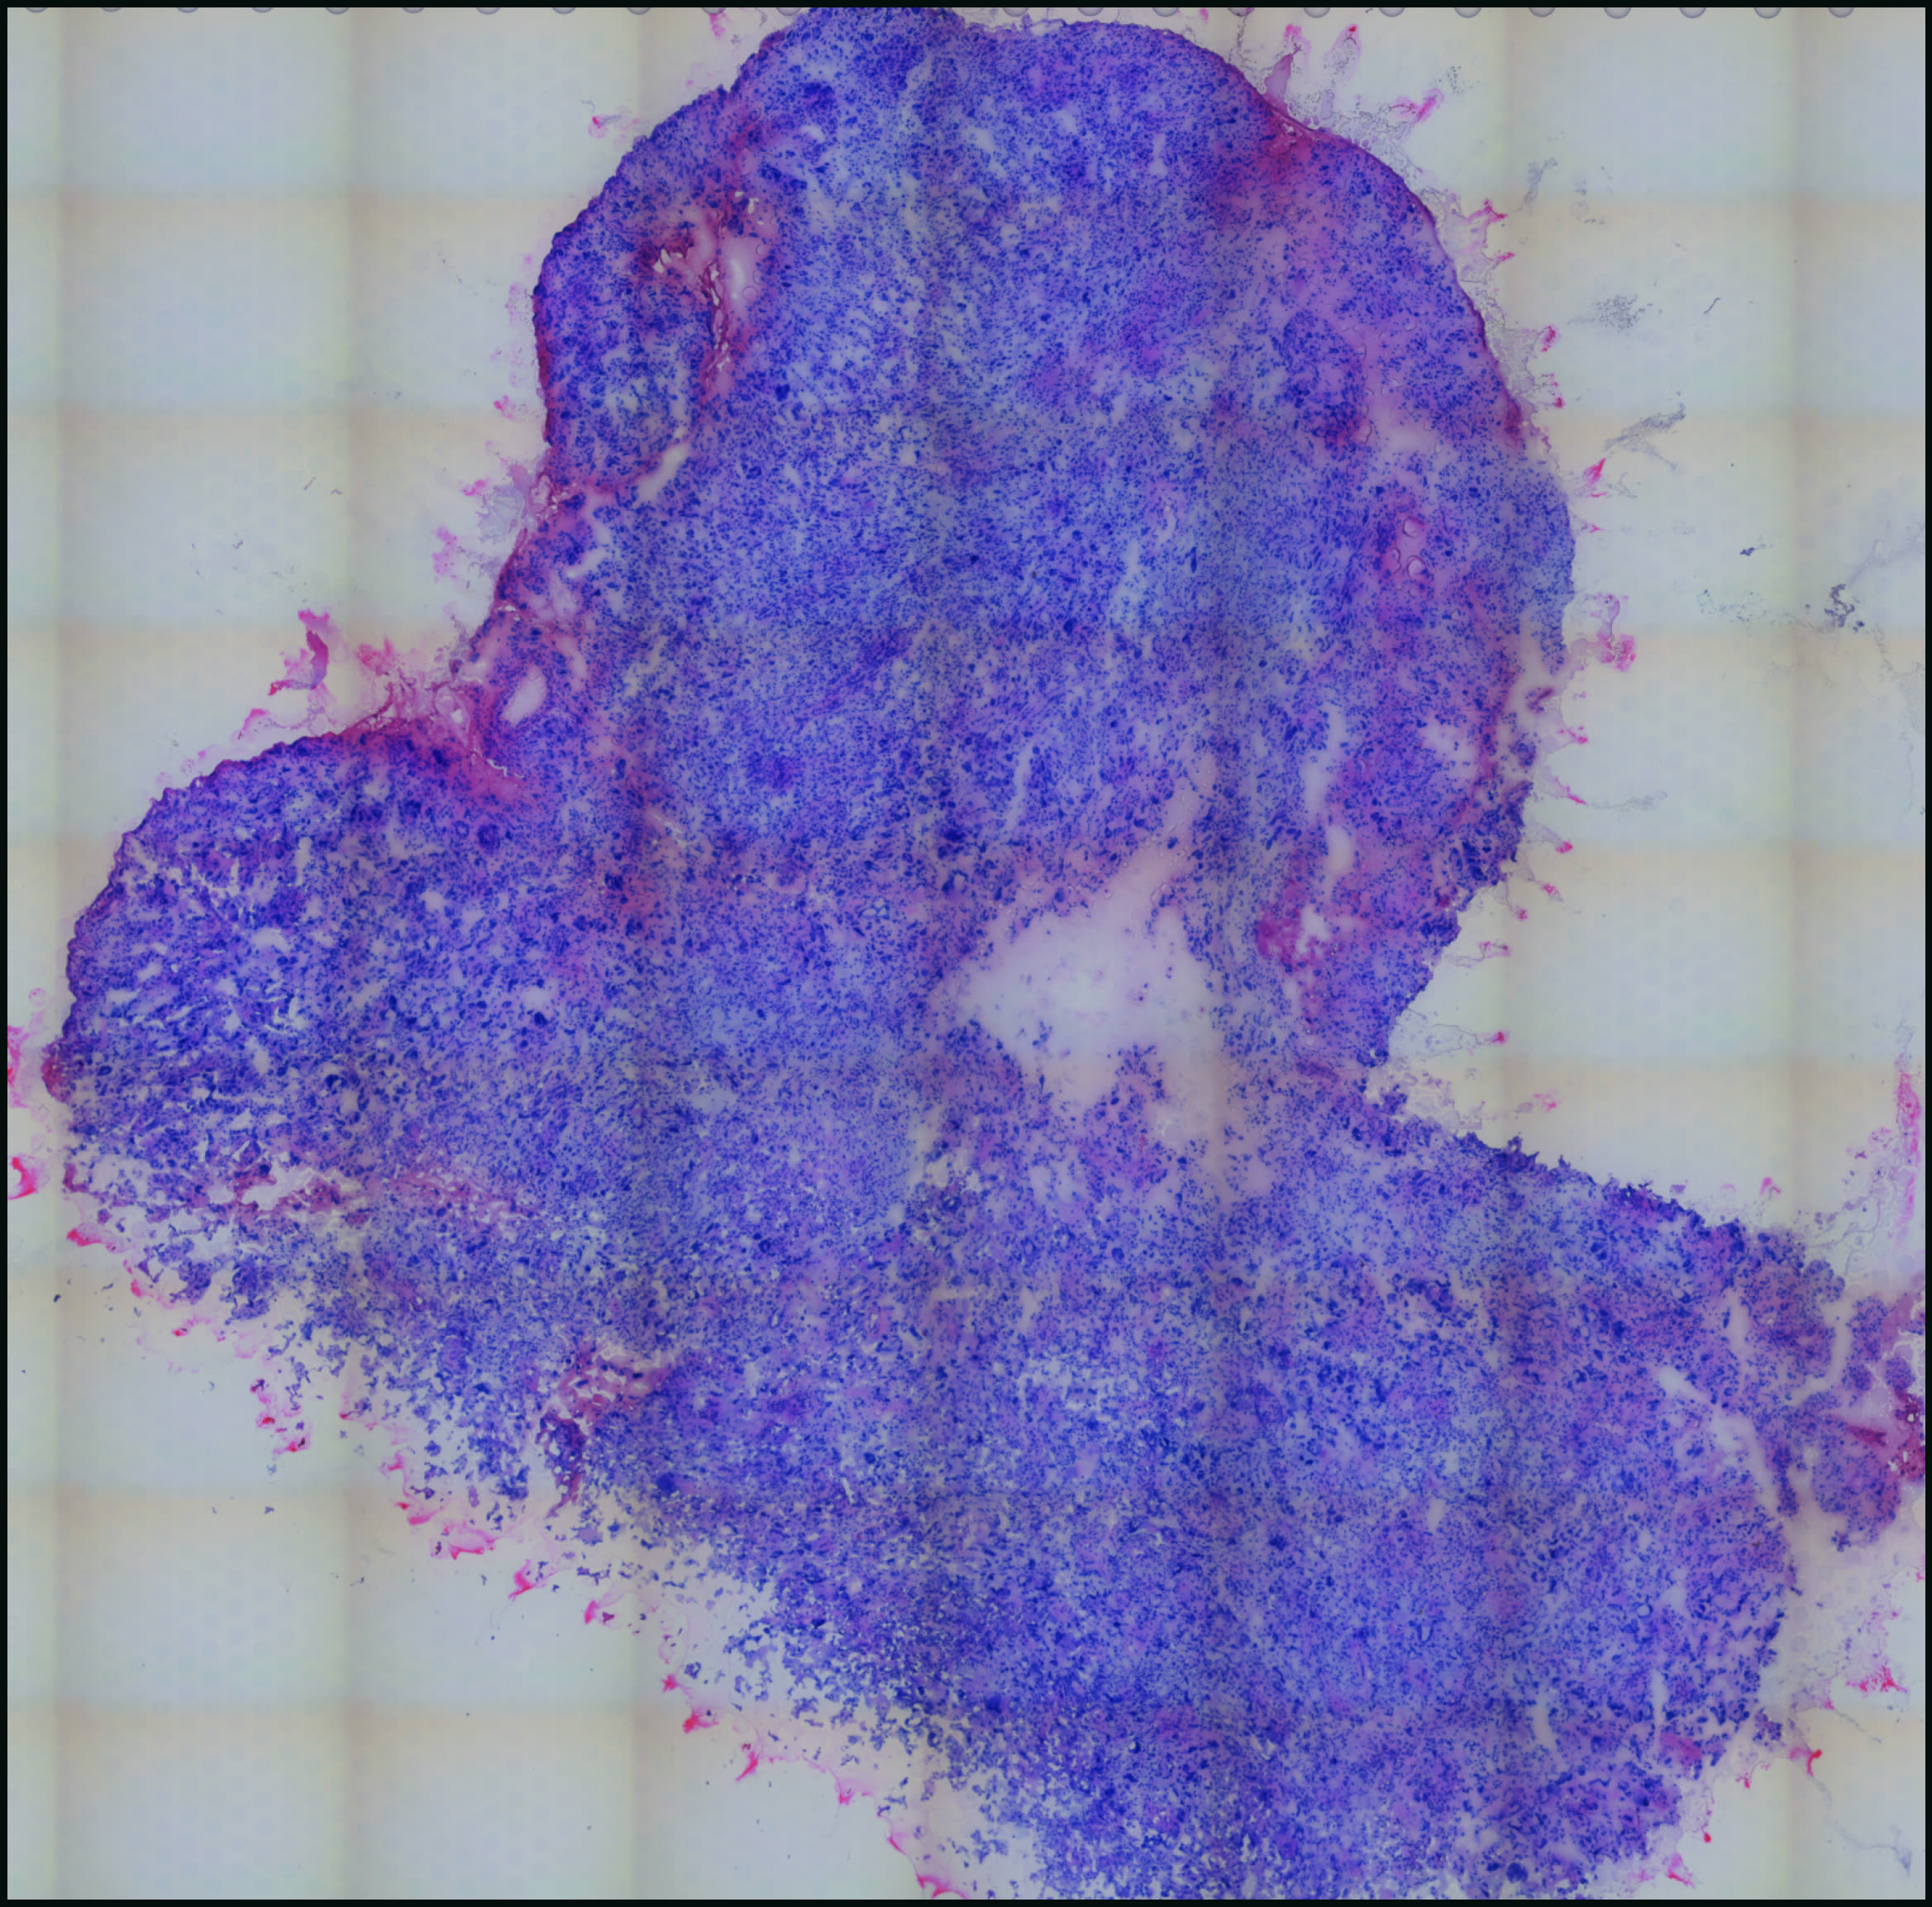
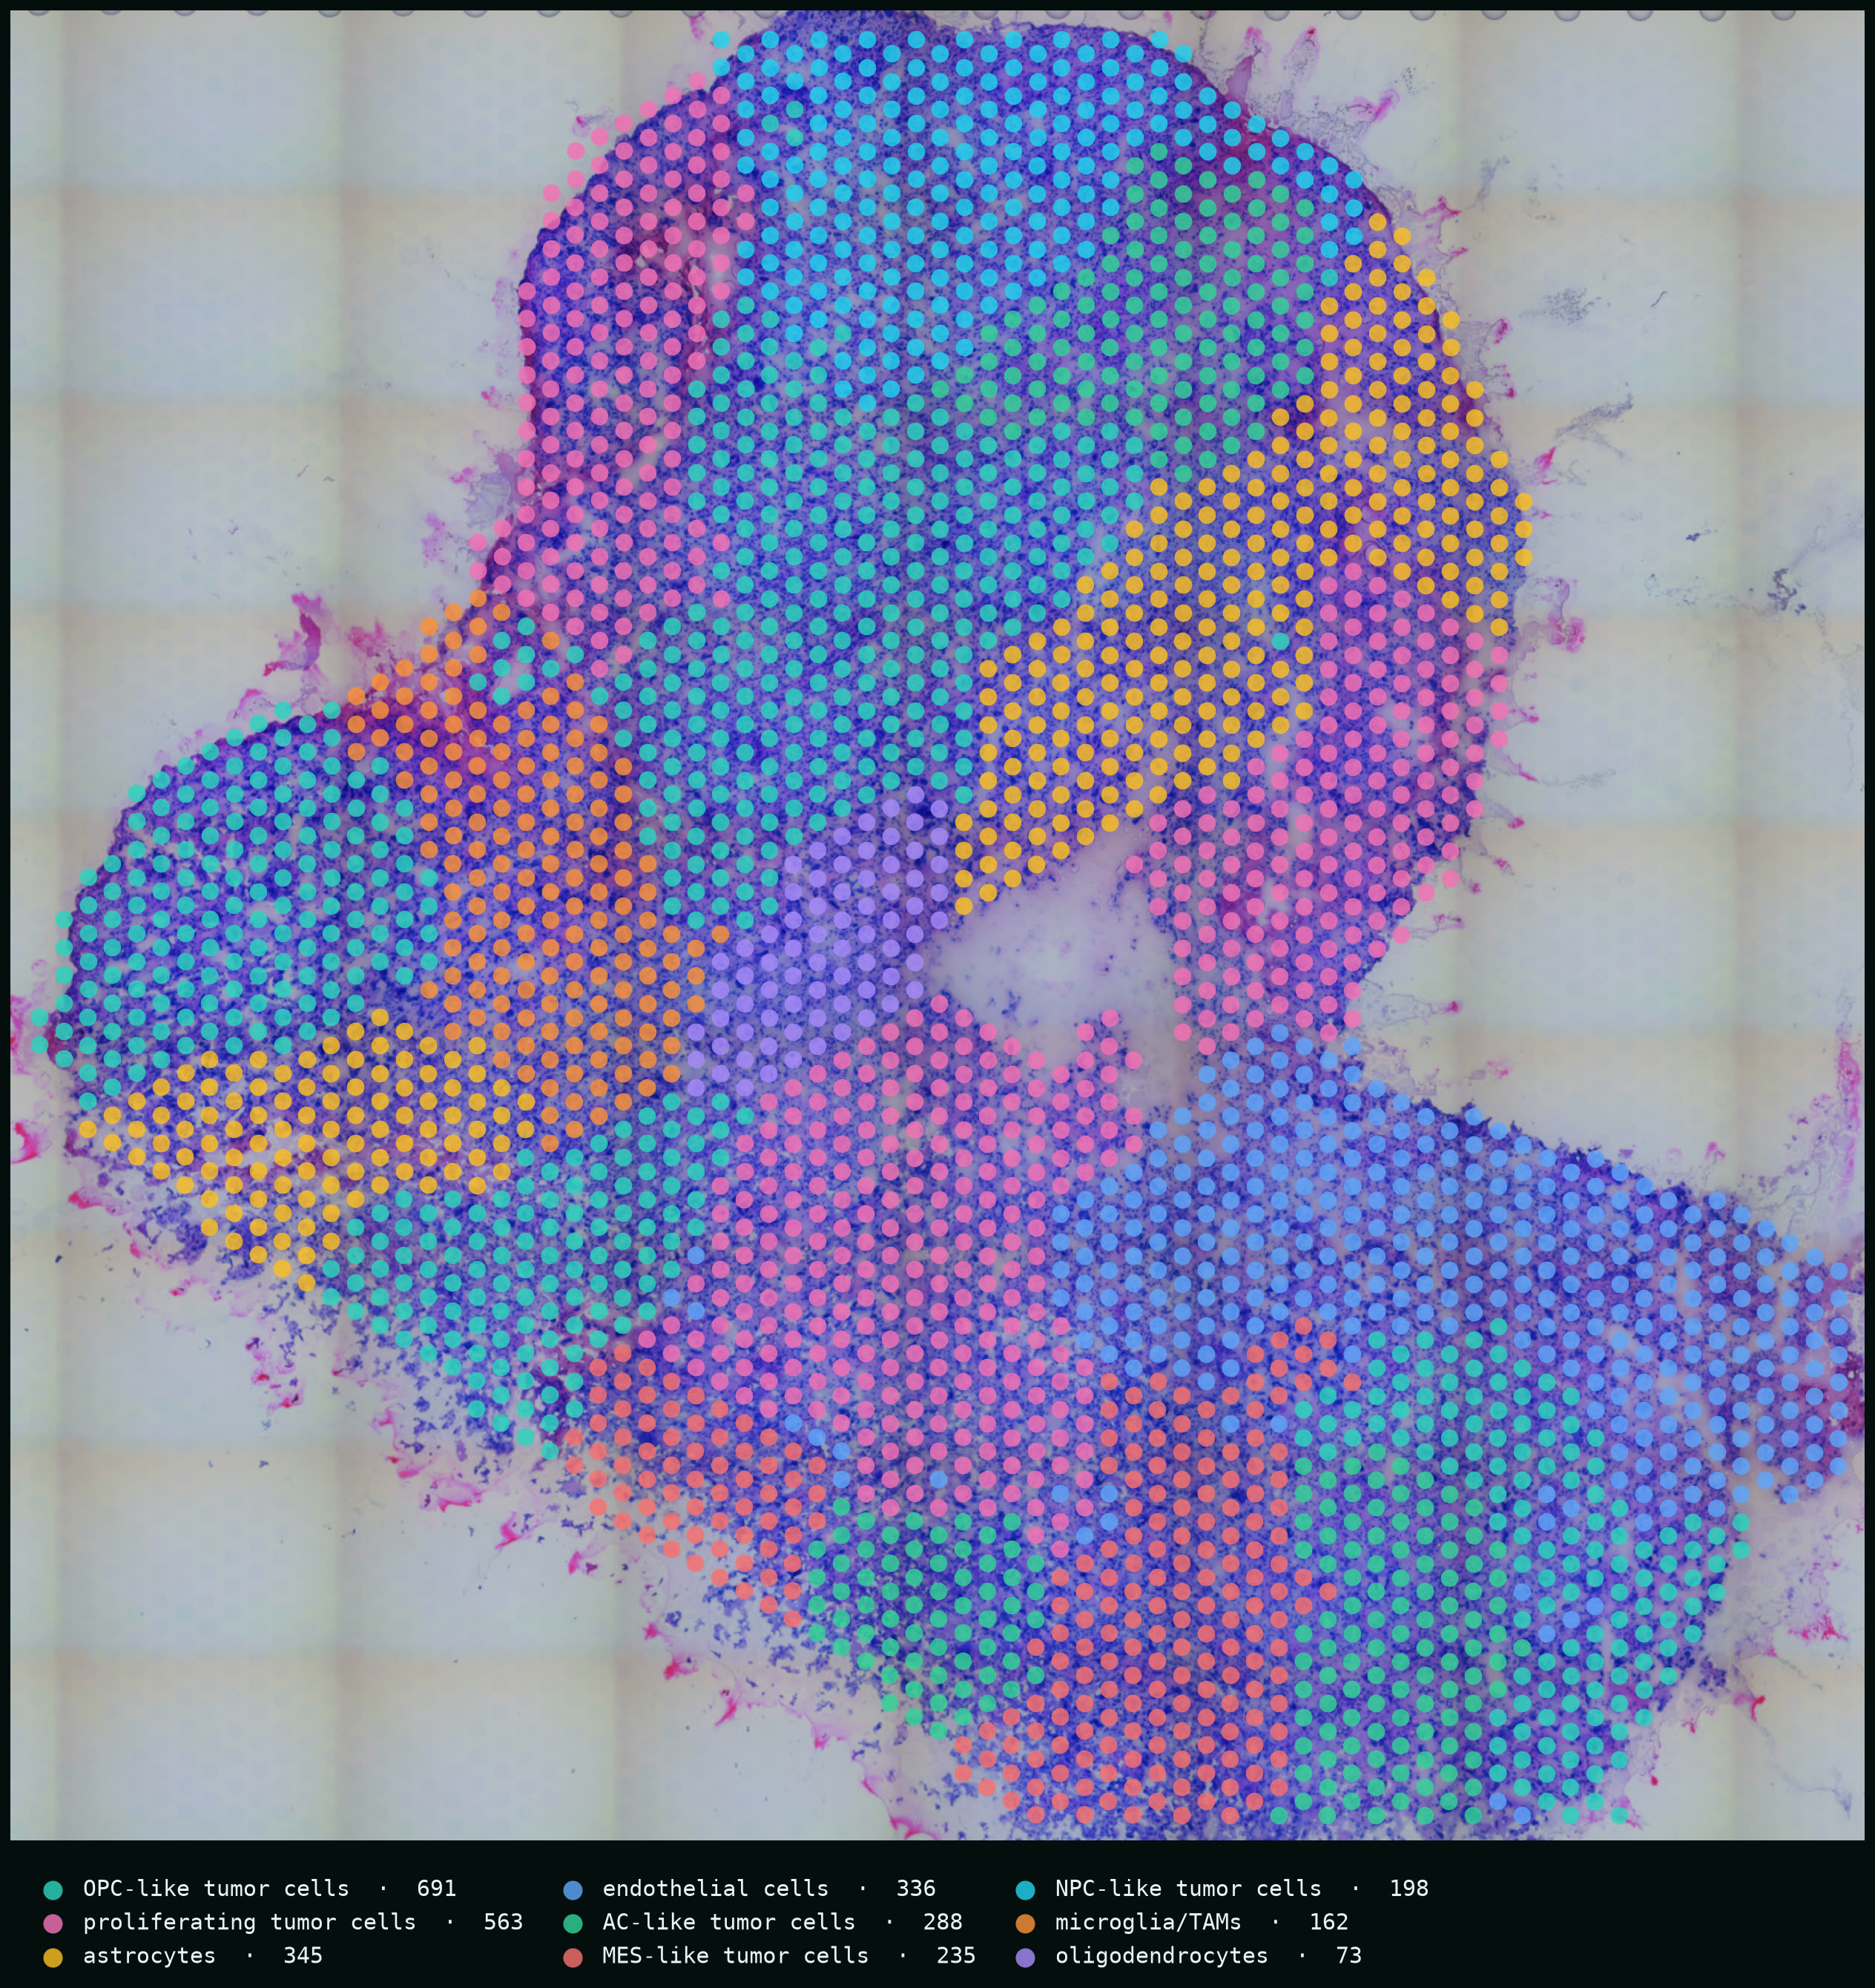
Domains emerge that follow the anatomy — this is the real GBM1 section, 4,764 spots, states model-annotated by the pipeline.
03 · GLIOBLASTOMA, LIVE
Five sections, one afternoon.
Five public glioma Visium sections — four adult high-grade gliomas from the Ren et al. 2023 cohort (GSE194329; two IDH-wildtype GBM, two IDH-mutant secondary), one glioblastoma from 10x Genomics — dropped into the pipeline unmodified. BANKSY domains, putative cell states, and marker maps, each with its own interactive Vitessce portal.
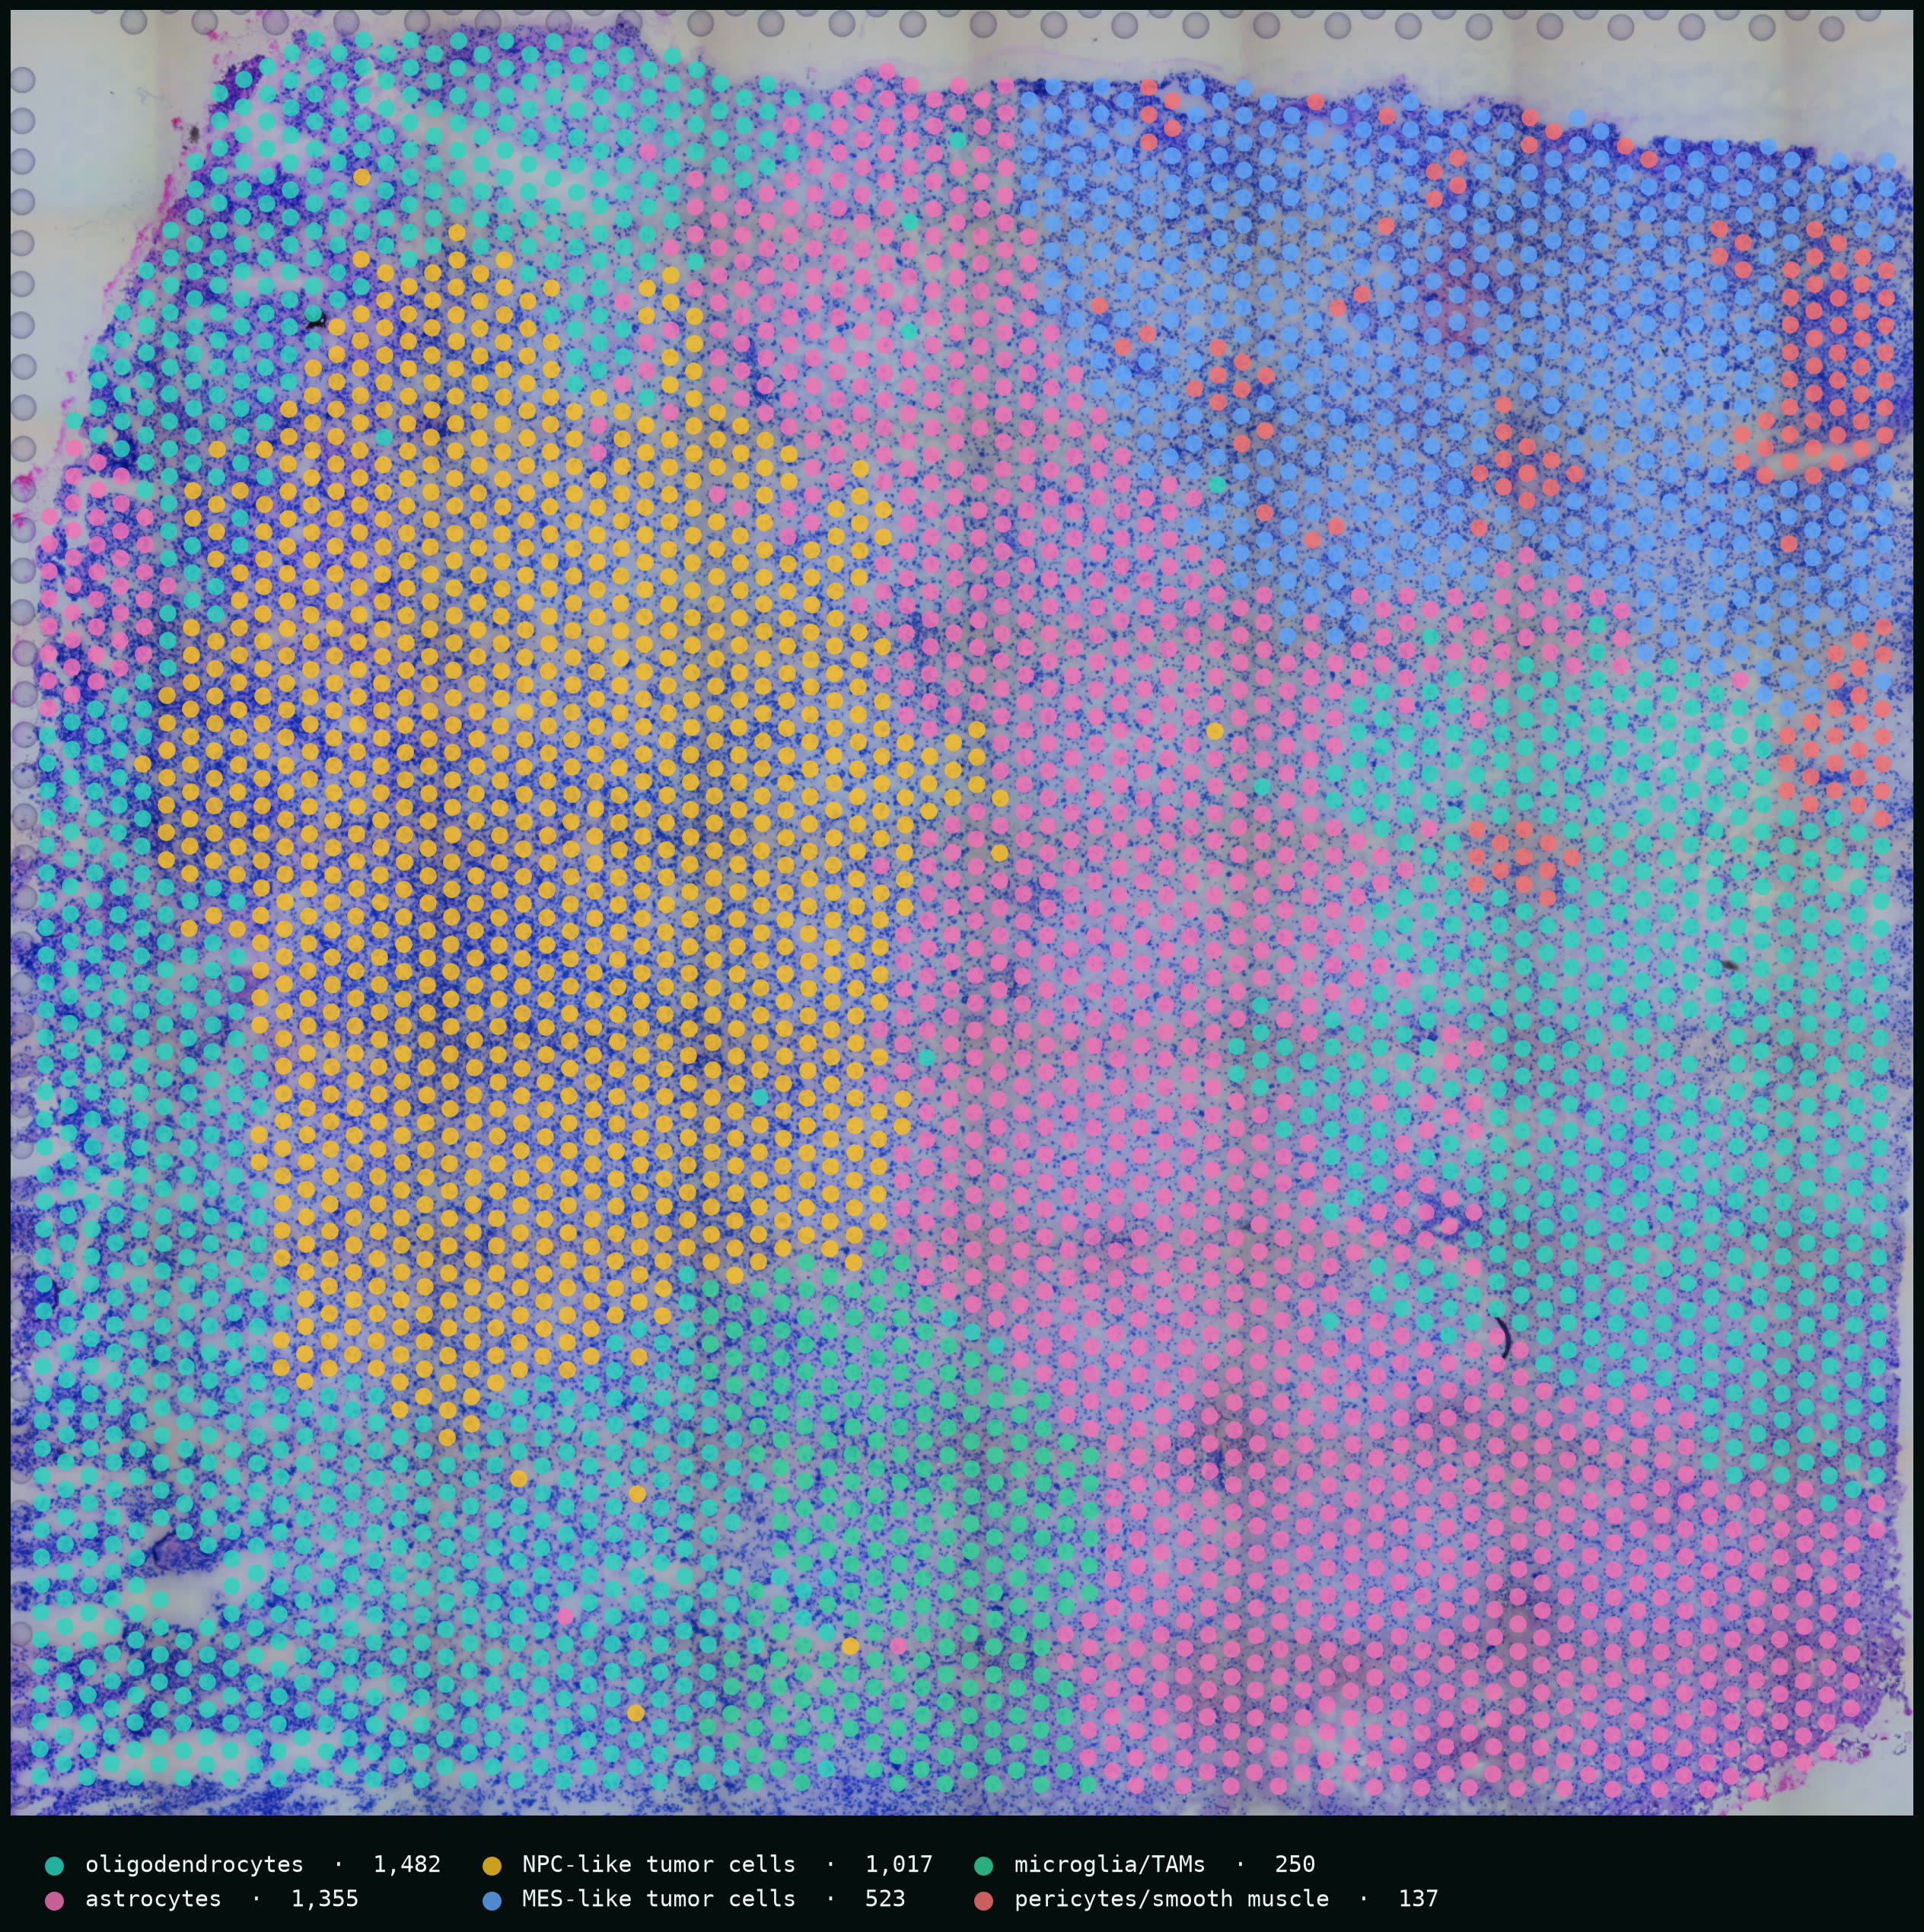
Fig. 2 | High-resolution H&E with BANKSY domains and cell states called by a local Qwen3-8B agent (the same pipeline runs on Claude when egress is fine) — click any view for full resolution. Public data: GSE194329 (Ren et al., Nat Commun 2023); 10x Genomics Parent Visium. Cell-state labels are model-annotated and not independently validated.
Fig. 3 | The live portal — three tumors and a local-LLM question, recorded headless in one take.
THE PORTAL
One selection, every view.
Lasso a region on the tissue and the same cells light up in UMAP, the heatmap and the gene list — Vitessce linked views over a chunk-optimized zarr, in the browser, no install.
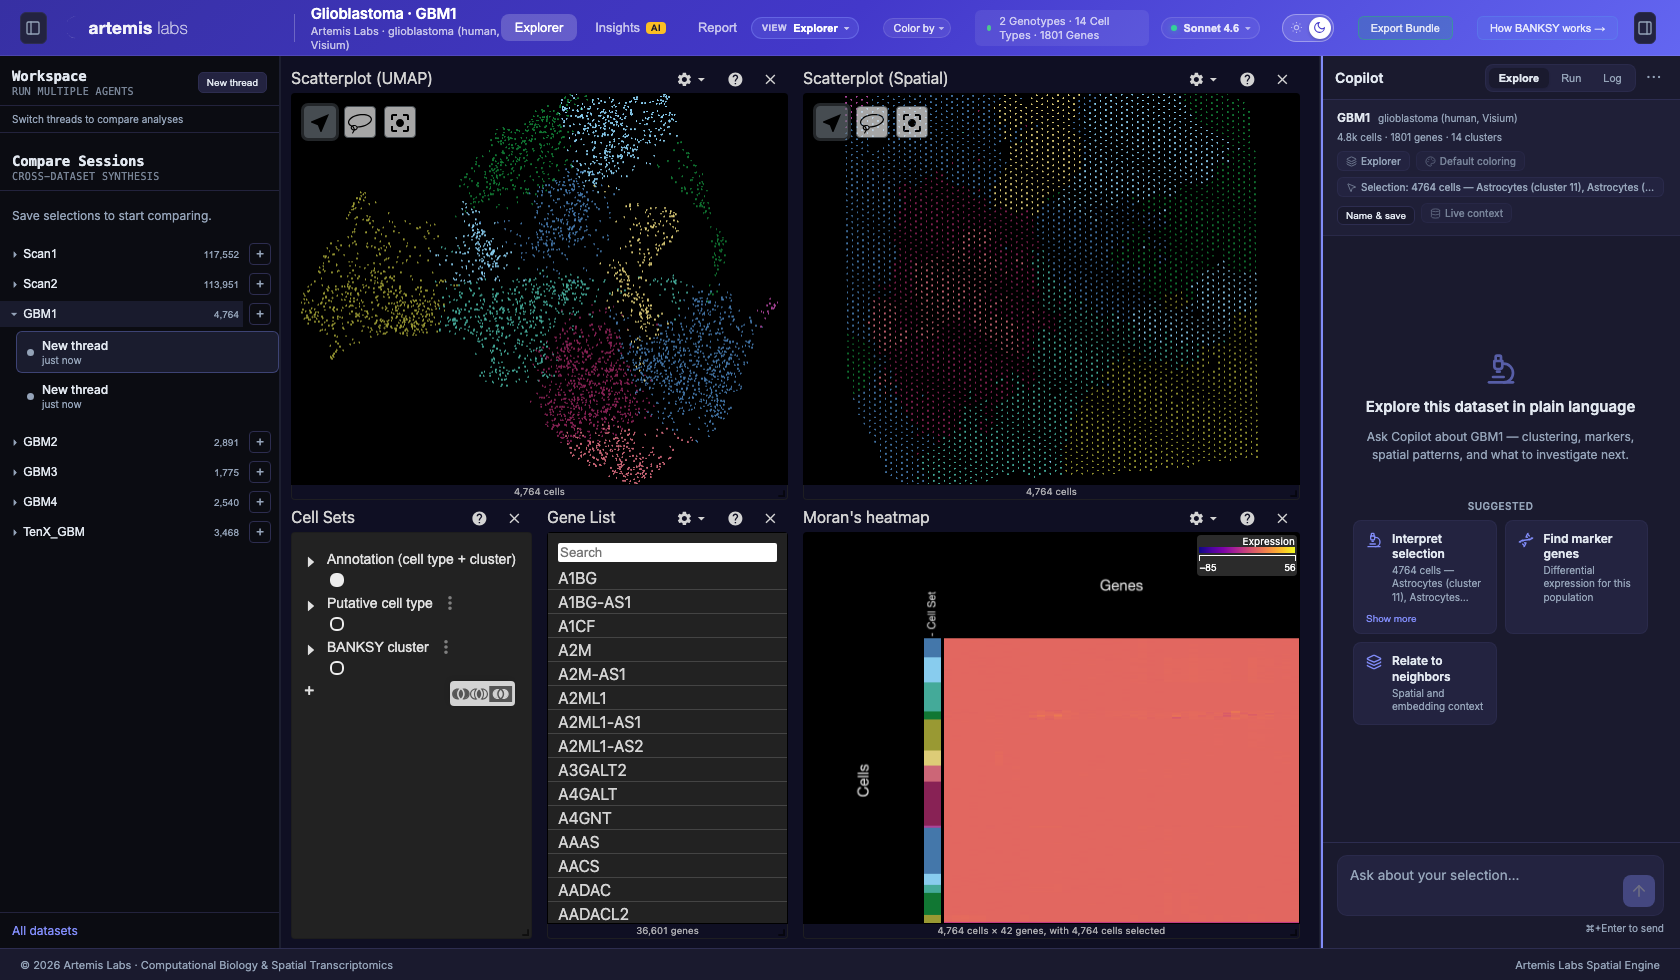
Fig. 6 | The portal as captured during the demo recording — GBM1 (4,764 spots) with UMAP + spatial linked views, cell sets, markers and the copilot rail.
Drop-in ingest
Any .h5ad or 10x Xenium folder — counts detected, coordinates verified, portal out.
Linked exploration
Spatial ⇄ UMAP ⇄ heatmap ⇄ gene list share one selection and one color encoding.
Ask the section
The copilot rail answers grounded questions — and can run with a local model through Ollama.
More ways to read a section.
Every portal carries the embeddings with it — UMAP beside tissue, gradients like diffusion pseudotime on demand. All computed from the runs shown above.
What's a UMAP?
A tissue section measures thousands of genes in every spot — far too many dimensions to look at. UMAP folds that space down to two, keeping neighbors close: spots with similar expression land near each other, and the clusters you see are real subpopulations. Some detail is always lost in the fold — which is why every UMAP on this page sits beside the tissue it came from.
Regulatory networks, next
Concept sketch — gene-regulatory-network inference (after Kamimoto et al. 2020): expression + chromatin in, transcription-factor modules out. Illustration, not data.
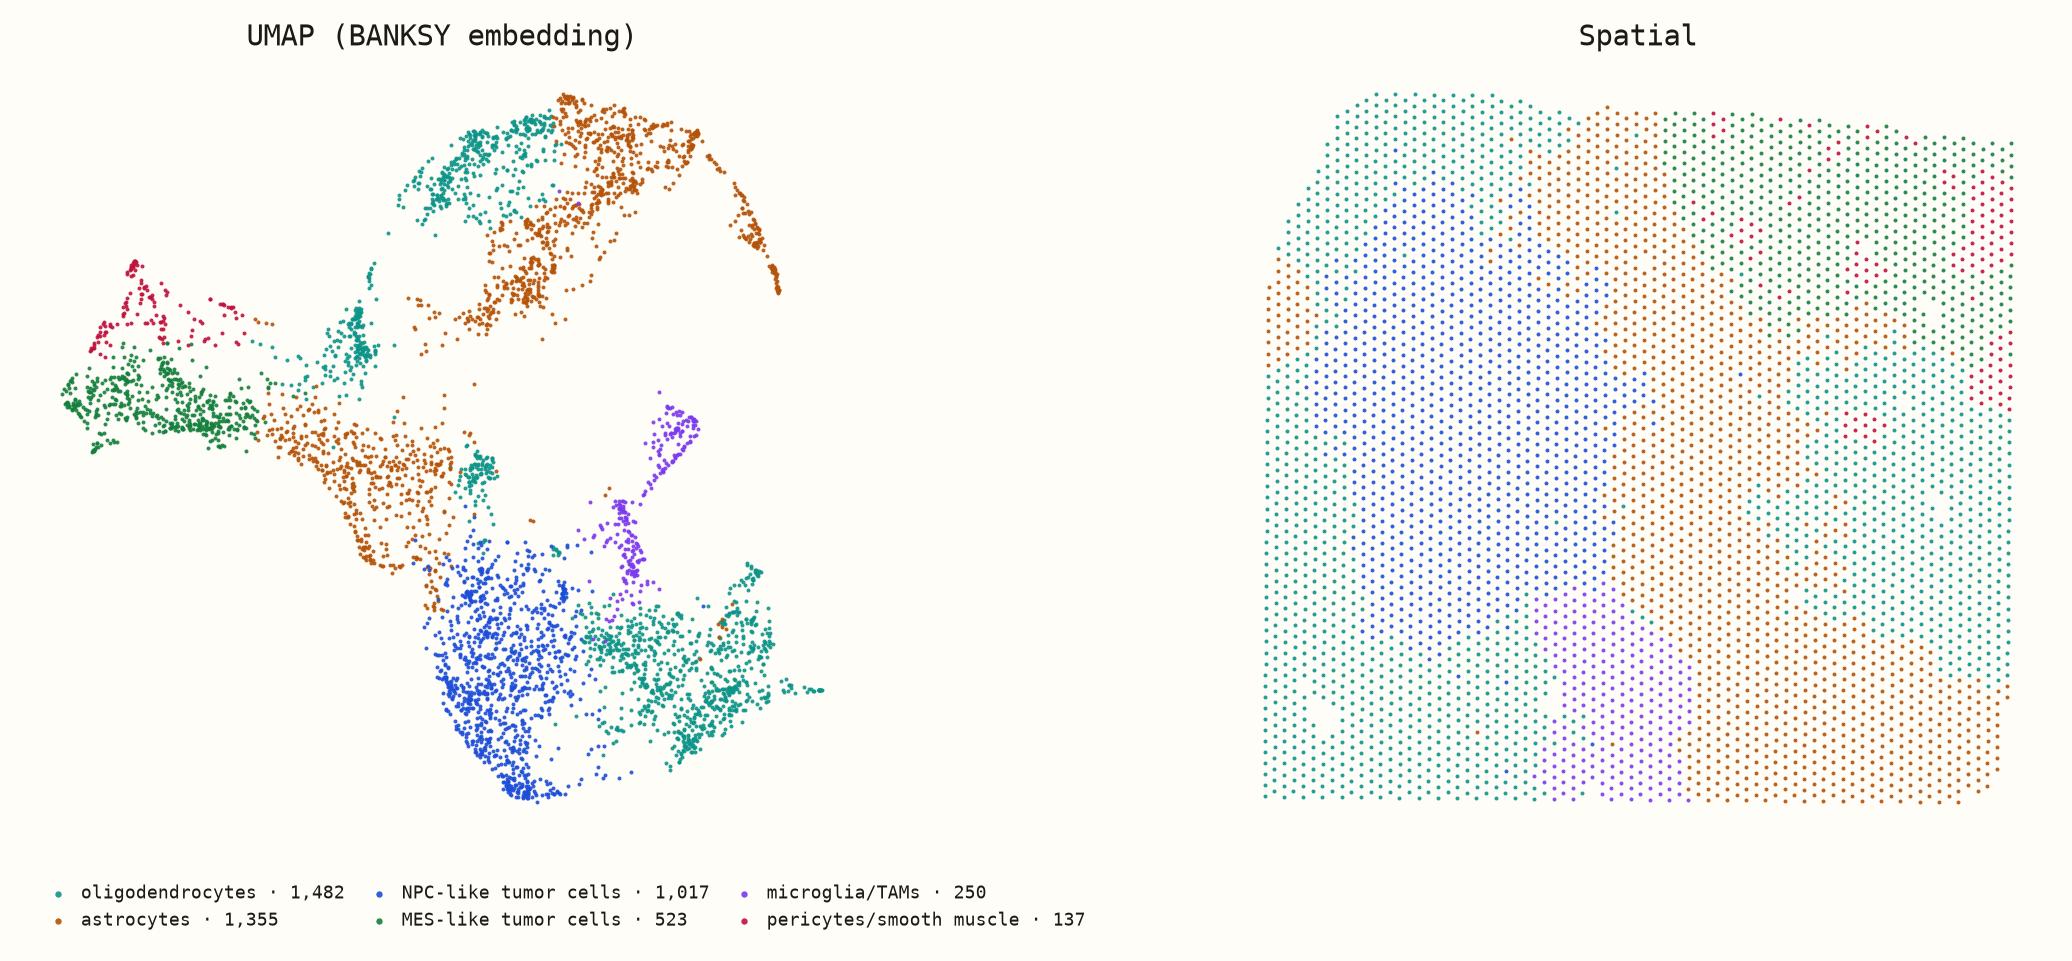
Fig. 7a | GBM1 — the BANKSY-embedding UMAP beside the tissue, one color per putative cell state.
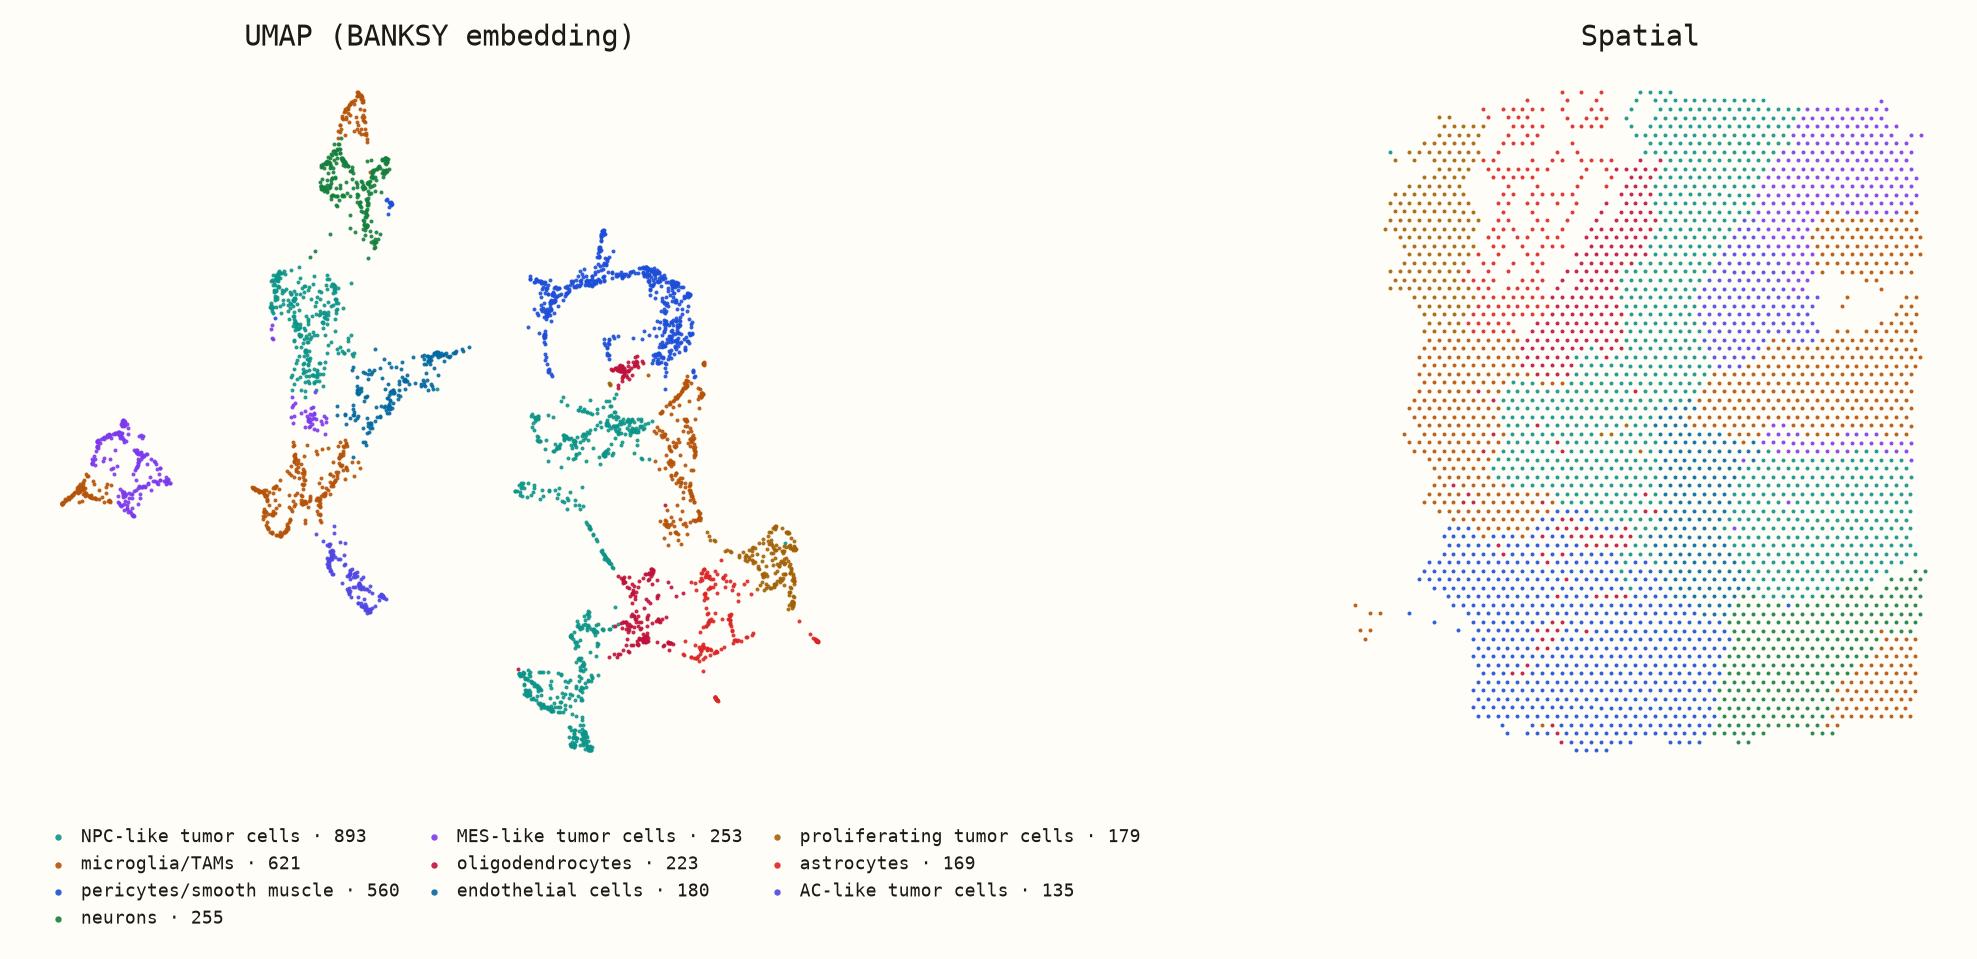
Fig. 7b | 10x GBM — same pairing on the fresh-frozen reference section.
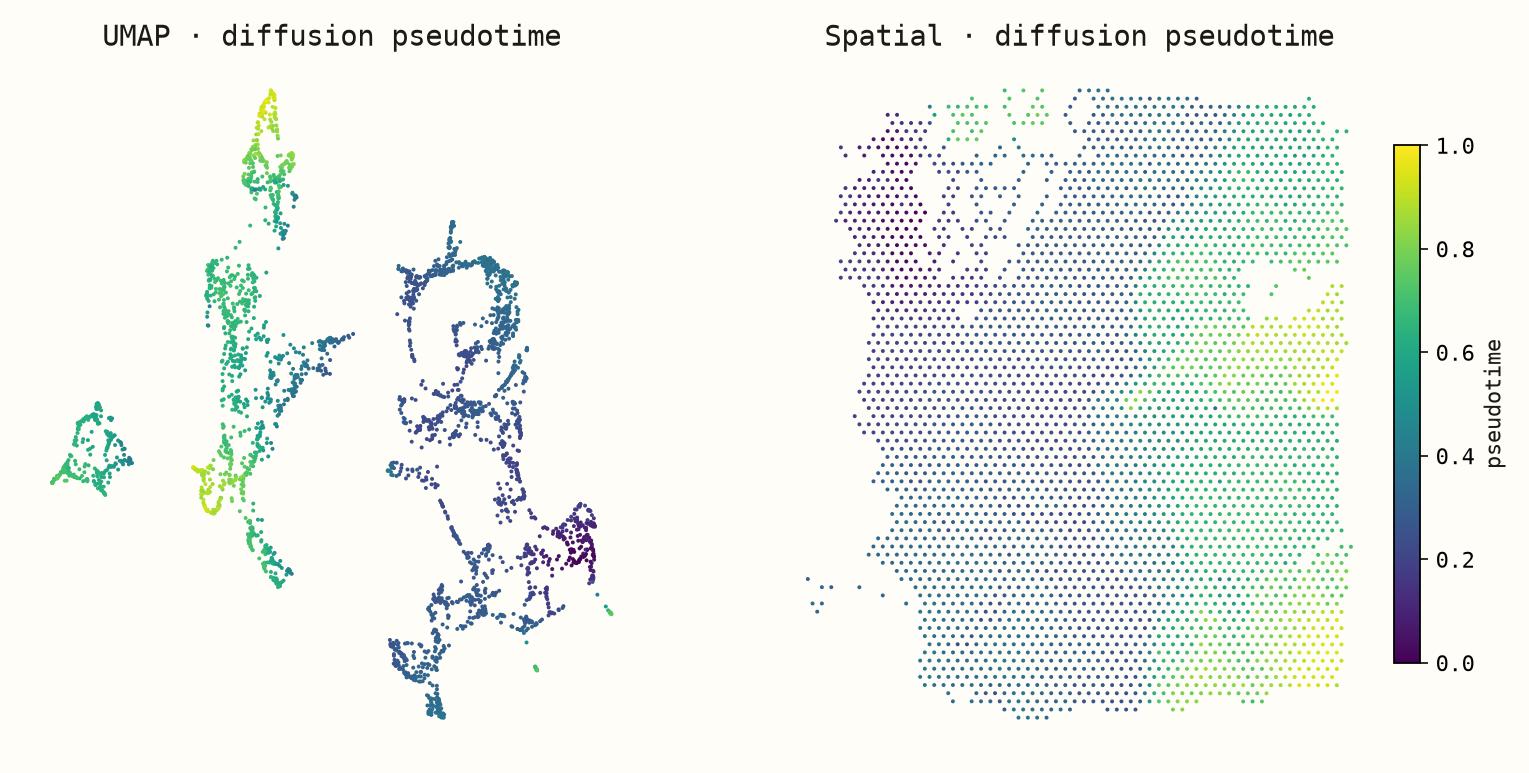
Fig. 7c | 10x GBM — diffusion pseudotime (scanpy DPT, rooted at the SOX2-max spot), on UMAP and on tissue. Exploratory: Visium spots mix cells, so read as a gradient, not a lineage.
04 · DE JONG ET AL. (NATURE 2026 · PREPRINT 2025)
A Nature paper, loaded overnight.
The claim in one line
GB heterogeneity is not chaos — one conserved, spatially patterned trajectory, developmental-like → gliosis → hypoxia, organizes cancer cells, subclones and the myeloid TME across tumours.
We pulled their public manuscript sections and imported them into the portal with the paper's own analysis intact: cell2location cell states, NMF spatial niches, and IvyGAP histopathology, each explorable next to the H&E. Open AT10 live →
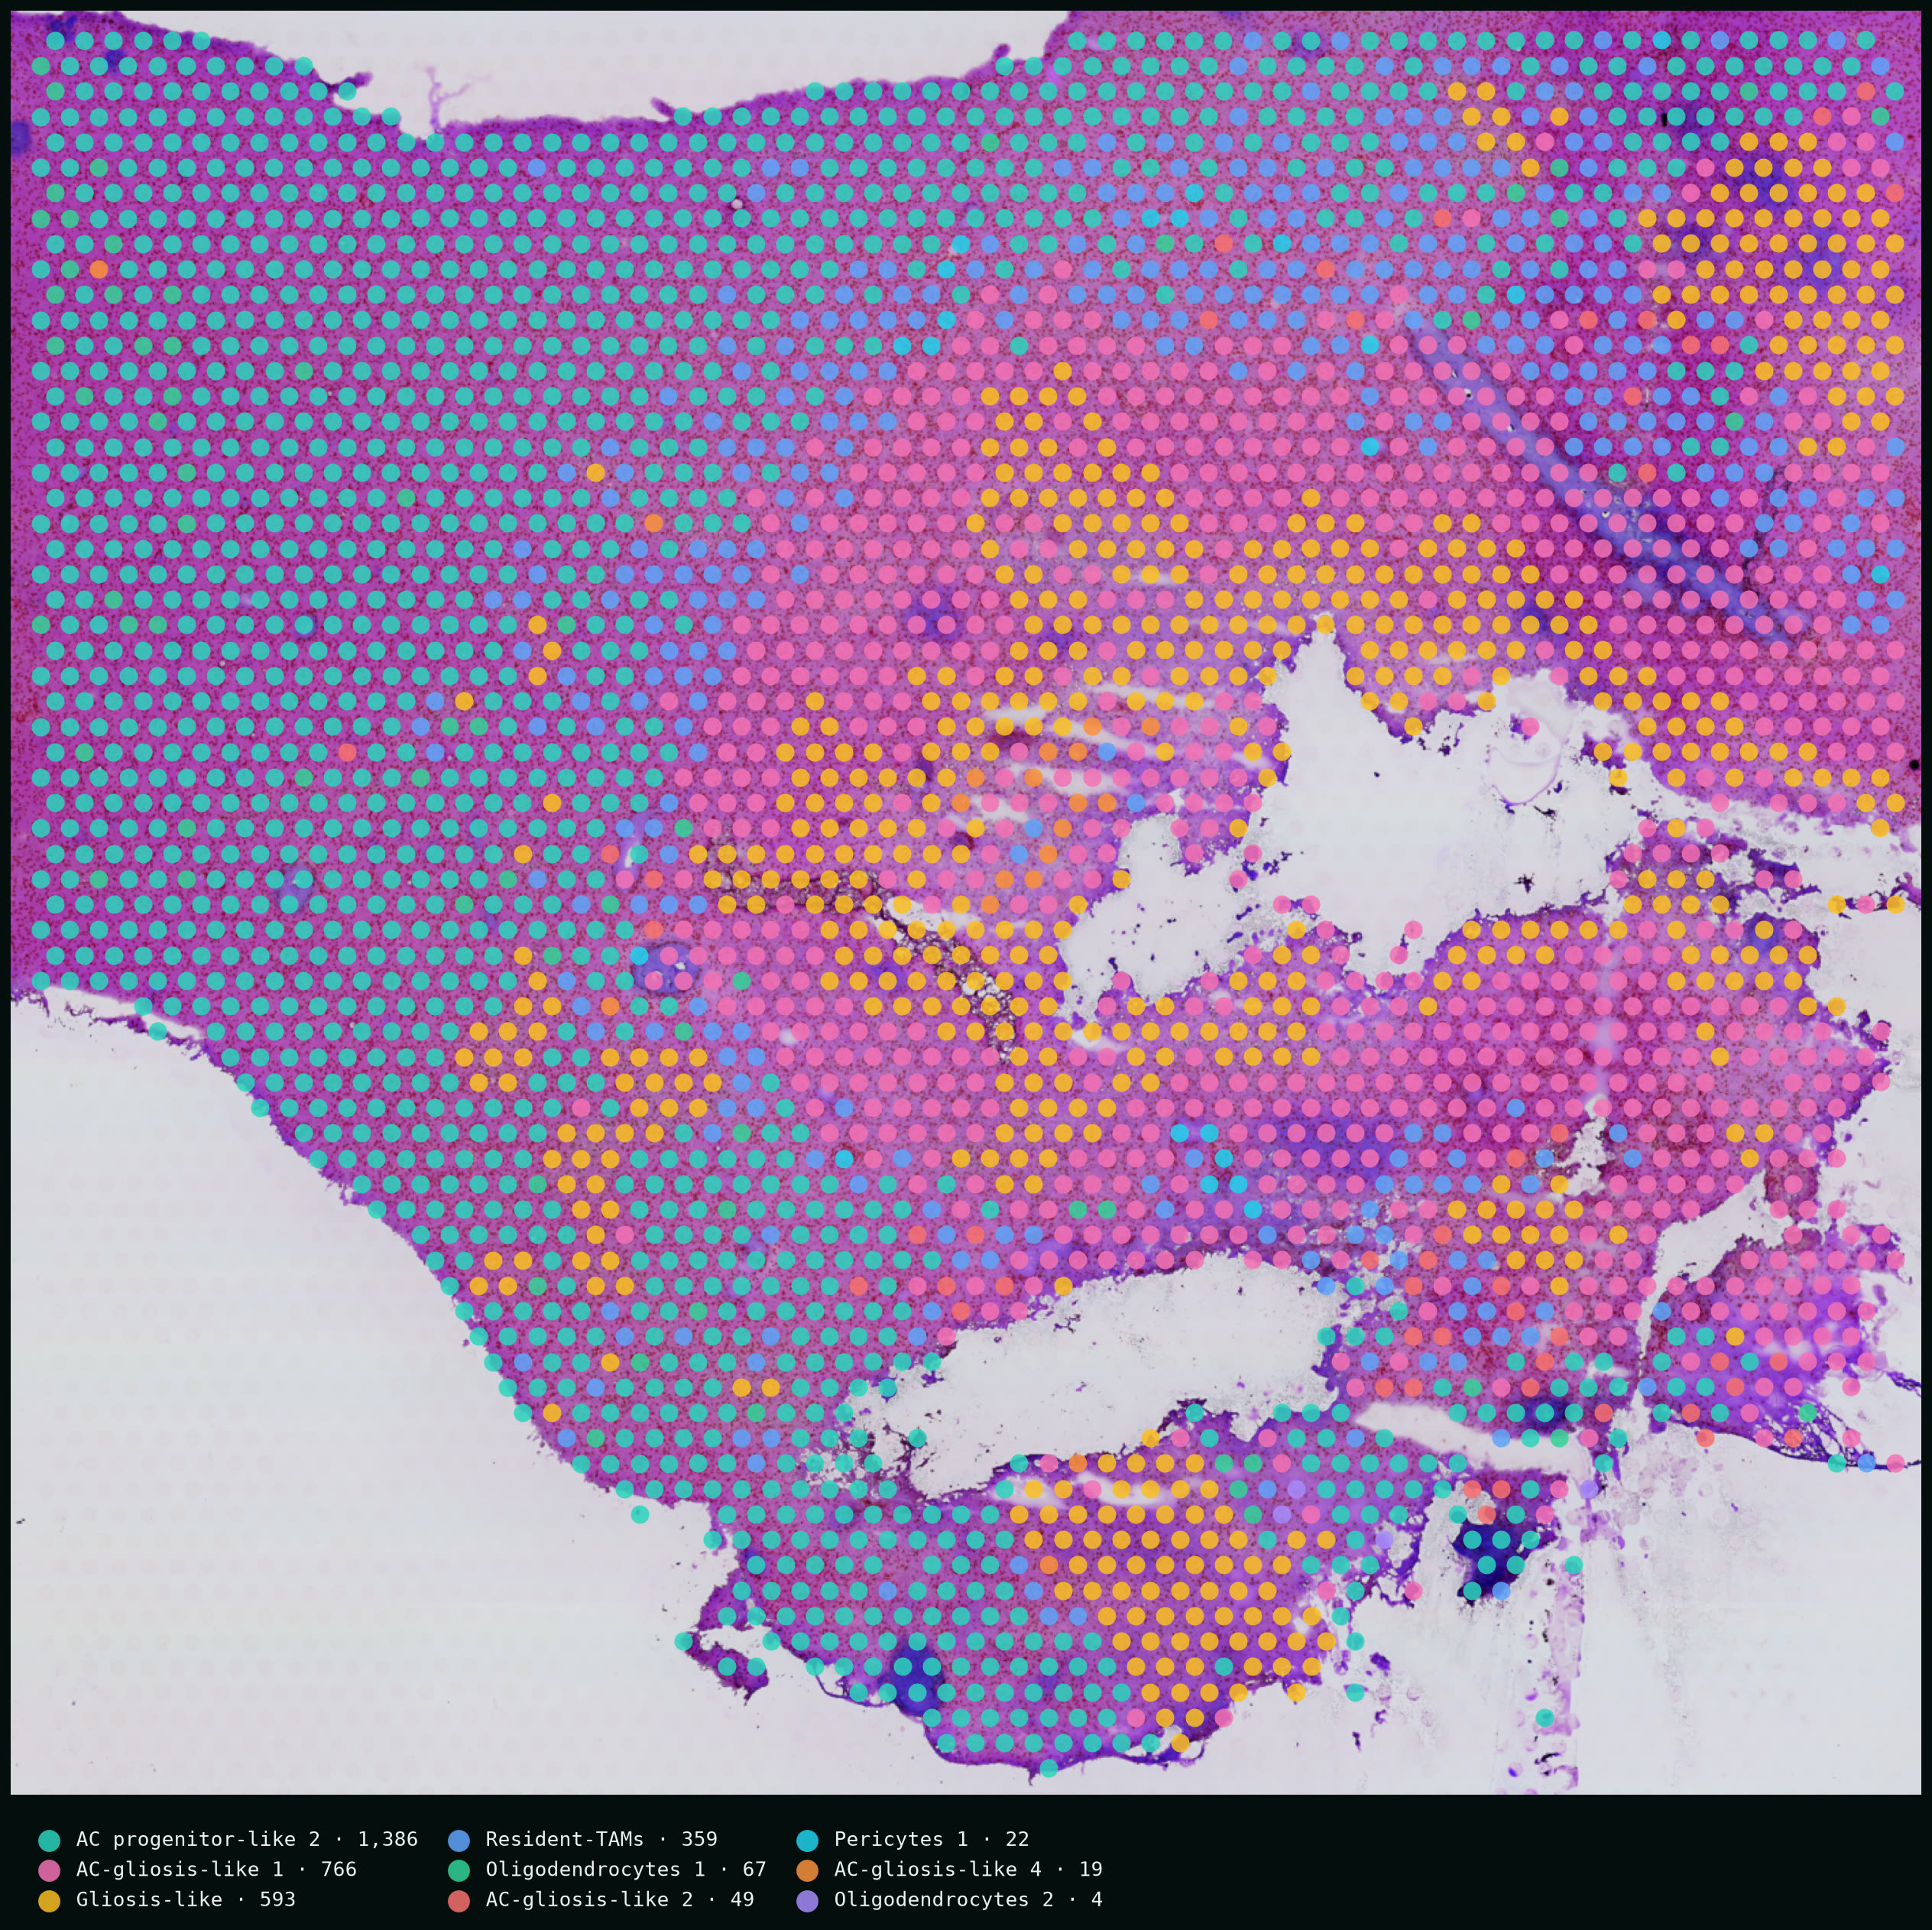
Fig. 4 | Imported unmodified — no re-clustering; the paper's own deconvolution and annotations drive every view. Data: de Jong et al., Nature 2026 (preprint 2025; open access) · gbmspace.org · doi:10.1038/s41586-026-11234-8. Nine sections live in the portal.
05 · WHAT WE DO
Every core your biotech would build or rent.
One AI-powered team.
Single-cell
Raw reads to annotated atlases · iPSC benchmarking
demo on request
CUT&Tag and chromatin
Peaks, tracks, differential binding
demo on request
Long-read sequencing
Isoforms, SVs and methylation
demo on request
Radiomics and imaging
Segmentation to outcome models
demo on request
Calcium imaging
Wave detection without hand scoring
demo on request
Clinical data and biostatistics
Cohorts, trials, survival models
demo on request
Custom apps: DNA Studio
Plasmid maps from SnapGene files
demo on request
Also bulk RNA-seq, variants, proteomics, metabolomics, cytometry and microbiome.
NOT JUST SPATIAL
Built for wet labs, whatever the assay.
Spatial is the showcase on this page — the engagement covers everything your bench produces. Below: a published CSF proteomics cohort (Hällqvist 2024, Nat Commun) independently reanalyzed in our notebook portal — volcano plots, cross-dataset validation, classifier rebuilds, and a reproducibility appendix where every figure ships with the code that made it.
Fig. 8 | The notebook portal reanalyzing Hällqvist et al. 2024 (CSF proteomics, 194 subjects, 32-protein MRM panel) — public data, every claim re-derived.
06 · DATASET CATALOG
The public GBM spatial atlas, catalogued.
Every public spatial-transcriptomics dataset of glioblastoma we could verify — platform, scope, and accession — ready to drop into the pipeline. Rows marked ● are already live in the portal.
Table 1 | Public GBM spatial transcriptomics datasets (n = 16).
| Dataset | Platform | Scope | Accession | Relevance |
|---|---|---|---|---|
| De Jong et al. 2025 preprint (Nature 2026), GBM-Space (Xenium) | 10x Xenium | 17 sections, 8 tumours (BioStudies S-BIAD2898) | S-BIAD2898 (BioImage Archive) | Anchor dataset; edge to core trajectory |
| ●De Jong et al. 2025 preprint (Nature 2026), GBM-Space (Visium + snRNA/snATAC) | 10x Visium (whole transcriptome) + snMultiome | 97 Visium sections, 12 tumours; 1,025,329 nuclei | E-MTAB-17164 (ArrayExpress); CELLxGENE | Same tumours as Xenium set, so it is the cleanest per-modality value-add comparison |
| Greenwald et al. 2024 (Cell), Tirosh lab | 10x Visium | 13 IDH-wt GBM + 6 IDH-mut glioma | GSE237183 | Hypoxia-driven 5-layer organization; overlaps de Jong hypoxia axis |
| Ravi et al. 2022 (Cancer Cell), Freiburg/Heiland | 10x Visium + MALDI + IMC | 28 specimens, 20 patients, 88,793 spots | Dryad doi:10.5061/dryad.h70rxwdmj | Includes non-tumour cortex, useful reactive-astrocyte reference |
| Pai et al. 2025, resection-margin multiome | 10x Visium + snRNA-seq + snATAC-seq | Visium from 2 GBM patients (1 per sex); multiome from 6 tumours | GSE286413 (spatial); GSE286419 (snRNA); GSE286415 (snATAC) | Closest public match to matched core-vs-margin sampling designs |
| Sonpatki/Shah et al. 2025-26, SNUH glioma atlas | 10x Xenium + Visium + scRNA/CITE-seq | Xenium 4 GBM patients; Visium 13 GBM (+ IDH-mut, normal) | Zenodo 17622242 (Xenium); Zenodo 17572905 (Visium) | Second public GBM Xenium cohort with a different panel; tests panel dependence |
| De et al. 2025, matrisome Xenium | 10x Xenium | GBM sections, grade 3, TMA of grade 2-4, TMA of GBM core and edge | S-BSST2273 (BioStudies) | Core/edge TMA plus non-cancer brain; ECM-focused panel may lack CNV-informative genes |
| Michigan cohort 2025 (bioRxiv), Ivy GAP niches | 10x Visium | 14 slides, 7 patients (8 primary, 6 recurrent) | Zenodo 16505469 | Recurrent (post-therapy) slides relevant to therapy-induced senescence question |
| Glioma LOH and ecDNA spatial study (2025) | 10x Visium + Visium CytAssist FFPE | 11 gliomas (FF) + 6 IDH-wt EGFR+ GBM (FFPE) | GSE242352 | Pairs spatial with DNA-seq, so CNV calls can be checked against ground truth |
| 10x Genomics, Xenium IO panel GBM | 10x Xenium | 1 donor, 816,769 cells | 10x public dataset | Large single-section Xenium test case |
| 10x Genomics, Xenium brain preview | 10x Xenium | 40,887 GBM cells; 24,406 healthy cells | 10x public dataset | Healthy cortex on same slide gives a normal astrocyte reference |
| 10x Genomics, Visium CytAssist gene + protein GBM | 10x Visium CytAssist (RNA + protein) | 1 donor | 10x public dataset | Protein layer (e.g. GFAP) for marker sanity checks |
| 10x Genomics, Visium FFPE brain cancer 11 mm | 10x Visium CytAssist | 1 donor; paired Flex scRNA from same block | 10x public dataset | Same-block single-cell pairing for deconvolution checks |
| Linnarsson lab 2025, GBM organoids | 10x Xenium | Organoids under hypoxia and plasma perturbation | S-BIAD1700 | Hypoxia perturbation; secondary, not tissue |
| Kastner et al. 2026, mouse GBM models | 10x Visium HD + Xenium + GeoMx | Visium HD 4, Xenium 2, GeoMx 12 | Zenodo 21873496 | Only Visium HD GBM found; mouse, so secondary |
| Hong Kong CosMx 6K cohort (abstract only) | NanoString CosMx 6K | 21 cases, 337,622 cells | No public deposit found | Watch list; ask authors if data will be shared |
Accessions verified against GEO, BioStudies, Zenodo, Dryad and vendor pages. Ask for the full review.
07 · COPILOT
An analyst inside every portal.
Every portal ships with a research copilot grounded in your dataset — clusters, markers, spatial statistics. Run it on Claude for frontier reasoning, or flip the model dropdown to a local open-source model through Ollama and keep the entire loop on your own hardware: no API keys, no cloud, no PHI exposure.
Values from output/TenX_GBM/report.md; Moran's I computed with the portal's live tool (backend/analysis/live.py) on the same section.
08 · THE STACK
Eight capabilities, one stack.
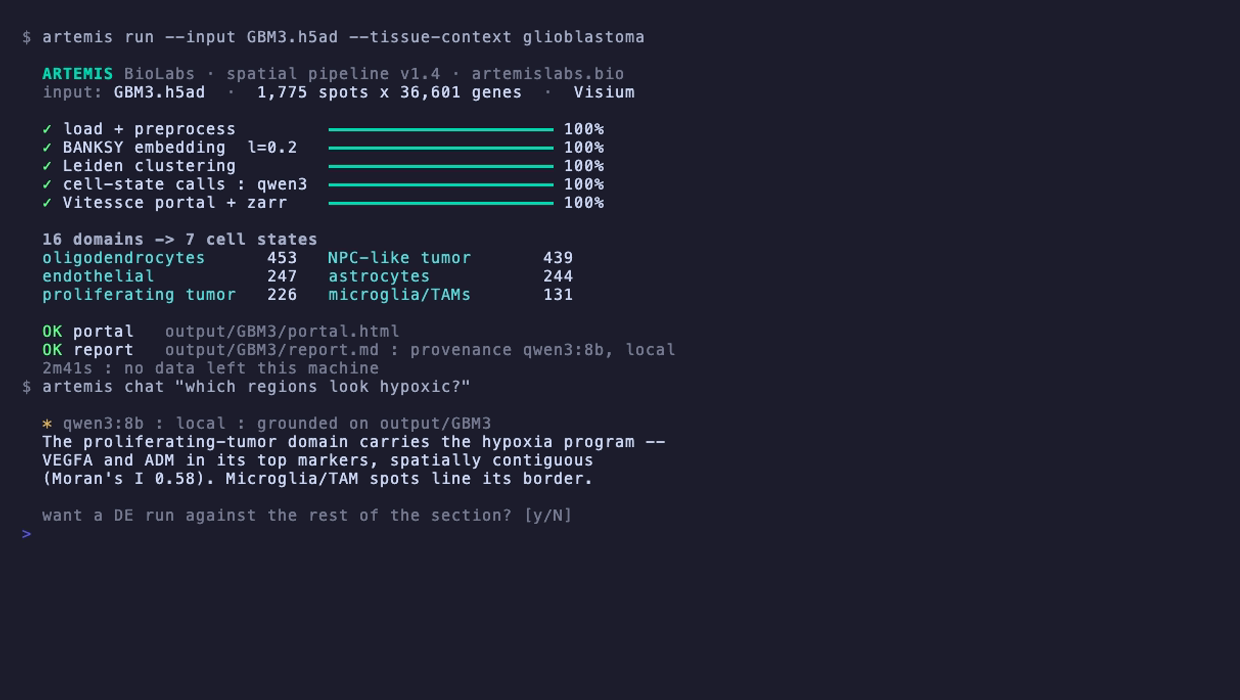
Fig. 5 | The stack, from the terminal.
09 · THE ENGAGEMENT
An embedded bioinformatics team.
Artemis BioLabs gives your lab an on-demand computational biology group and AI analysis platform for $3,000–$5,000 per month, scaled by data volume, complexity and infrastructure — with unlimited ongoing analysis and support, not per-dataset or per-figure billing. Assay-agnostic: one engagement covers every modality below, our agents working alongside a PhD bioinformatics team.
Single-cell & single-nucleus
scRNA/snRNA-seq (10x, Smart-seq), scATAC, multiome, CITE-seq — annotation, trajectories, DE, pathways, cell–cell communication.
Epigenetics & chromatin
Bulk and single-cell ATAC, CUT&RUN, CUT&Tag, ChIP-seq, WGBS/EM-seq, methylation arrays, Hi-C and chromatin conformation.
Spatial omics & imaging
Xenium, MERFISH, CosMx, seqFISH+, Visium & Visium HD, Slide-seq, CODEX/PhenoCycler, spatial ATAC & CUT&Tag — segmentation to niches to interactive portals.
Bulk & functional genomics
Bulk RNA-seq and GSEA, ribosome profiling, CRISPR/Perturb-seq screens, TCR/BCR repertoires, Nanopore & PacBio long reads, SVs, WGS/WES annotation.
A typical engagement includes
- Unlimited analysis requests and scientific support
- Pipeline setup, execution, QC and troubleshooting
- Publication-ready figures, tables and statistics
- Biological interpretation, grounded in the literature
- Reanalysis of public cohorts (GEO, CELLxGENE, ARCHS4) beside your data
- Reproducible workflows with documented parameters and provenance
- Interactive portals for spatial and high-dimensional datasets
- Regular working sessions with the computational team
Tiers
$3,000/mo — standard ongoing support
$5,000/mo — high-volume, multimodal, spatial or infrastructure-heavy work
We set the tier together after a short conversation about your assays, data volume and priorities.
Book 20–30 minutesbuilt by a researcher-founder
who ran these analyses before selling them.
pipelines that ran, not promises
every figure on this page came from an end-to-end run on public data — Visium and CODEX today, Xenium ingest in the same stack.
GSE194329, reproduced
everything on this page was generated end-to-end from public data. Ask for the code.

Your data has a story.
If your lab is sitting on spatial data and short on computational hands, the first analysis is on us — pick a public or in-house dataset and we'll turn it around as a live portal.